Why America’s Richest Cities Keep Getting Richer
They are not just the places where the most ambitious and talented people want to be—they are where such people feel they need to be.

In the fall of 2013, in a hotel suite overlooking New York City’s Times Square, the gaming giant Electronic Arts unveiled Cities of Tomorrow, the latest addition to its hugely successful SimCity franchise of computer games. Rather than racking up points the usual way, by killing bad guys, players of the SimCity series take charge of cities. In the role of mayor, they have the power to change things like tax rates, zoning ordinances, and land-use regulations, and to take action to boost economic development and create jobs. In the latest iteration of the game, by clicking on individual citizens they can see the effects they are having on people’s lives.
Recommended Reading


In Cities of Tomorrow’s grim future, there is a technologically advanced infrastructure that’s owned by an elite cadre known as ControlNet. The mayor can do things to limit their power, but only at the risk of stifling the city’s economic growth. Too little growth, and the city devolves into dystopian squalor; too much, and it becomes so unequal that its citizens can hardly afford to live in it. To succeed, players must find and navigate the precarious path between those two equally unpalatable urban alternatives.
Sound familiar? The futuristic city might be an in-game fiction, but the basic dilemma that the game describes is playing out in real cities today. The most important and innovative industries and the most talented, most ambitious, and wealthiest people are converging as never before in a relative handful of leading superstar cities that are knowledge and tech hubs. This small group of elite places forge ever forward, while most others struggle, stagnate, or fall behind. This process is one I like to call winner-take-all urbanism.
While that phrase is my own coinage, the broader phenomenon of winner-take-all economics has been recognized for quite a while. Almost 20 years ago, the economists Robert H. Frank and Philip J. Cook popularized the concept of the winner-take-all economy and society. The rudiments of the theory are evident in the labor market for professional athletes: As high as the salary of the average athlete may be, the pay gap between middling players and superstars is enormous. Frank and Cook saw this winner-take-all phenomenon spreading throughout the broader economy, as large pay disparities appeared in industries ranging from consulting, banking, and management to design, fashion, medicine, and law. The earnings gap between CEOs and the average worker soared. In the roughly four decades spanning from 1978 to 2015, CEO pay increased by more than 940 percent, while that of a typical worker grew by just 10 percent. The average CEO earned 20 times what the average worker did in 1965; by the 2000s, the ratio had grown to more than 300 to 1, where it has remained since.
Cities have been caught up in this winner-take-all phenomenon, too. Just as the economy confers disproportionate rewards to superstar talent, superstar cities, to borrow a phrase originated by the researchers Joseph Gyourko, Christopher Mayer, and Todd Sinai, similarly tower above the rest. They generate the greatest levels of innovation, control and attract the largest shares of global capital and investment, have huge concentrations of leading-edge finance, media, entertainment, and tech industries, and are home to a disproportionate share of the world’s talent. They are not just the places where the most ambitious and most talented people want to be—they are where such people feel they need to be.
This dynamic is cumulative and self-reinforcing. Superstar cities’ expanding economies spur demand for more and better restaurants, theaters, nightclubs, galleries, and other amenities. Successful businesspeople and entrepreneurs endow their museums, concert halls, private schools, and universities. Their growing tax revenues are plowed into new and better schools, more transit, better libraries, more and better parks, and so on, which further reinforces and perpetuates their advantages. They have unique kinds of economies that are based around the most innovative and highest value-added industries, particularly finance, media, entertainment and tech; businesses in superstar cities are formed and scaled up more quickly. All of this attracts still more industries and more talent. It’s a powerful, ongoing feedback loop that compounds the advantages of these cities over time.
Moreover, the advantages that accrue to superstar cities are substantially more enduring than those that accrue to superstar talent. No matter how big the name, talent rises and falls. Professional athletes have relatively short careers and can be sidelined by injuries, and even the biggest draws at the movie-theater box office grow older and fade with time. Big cities can and do decline, of course—Detroit was a big, prosperous city at one time—but the biggest and most dominant ones tend to redouble their strengths. Over less than two decades, New York City was hit by a massive terrorist attack, the collapse of its tech economy in the dot-com bust, a globe-shaking financial crisis in 2008, and Hurricane Sandy, and yet it remains the most economically powerful city in the world.
Real-estate prices provide a clear indicator of the dominance of superstar cities, and the large gap between them and the rest. To get at this, I tracked housing prices in the more than 11,000 zip codes across America for which the real-estate firm Zillow has data. There are just 160 zip codes where the median home price was $1 million or more; 80 percent of them were located in the New York, Los Angeles, and San Francisco metro areas. All but four of the 28 zip codes where median home values were more than $2 million were located in or around these three cities: 11 in the San Francisco Bay Area, seven in LA, and six in New York. In 2016, 57 percent of homes in the Bay Area were valued at more than a million dollars, up from less than 20 percent of them in 2012. Meanwhile, 56 percent of the zip codes for which data are available have median home values of less than $200,000, and roughly 15 percent have median home values of less than $100,000.
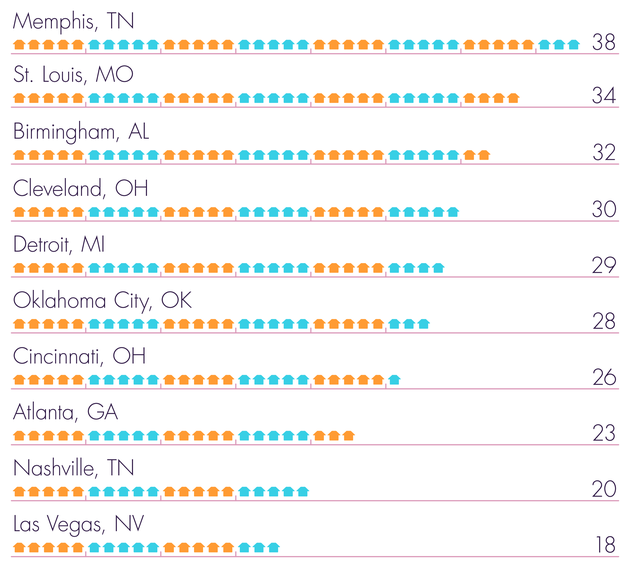
One way to visualize the enormity of the gap between superstar cities and the rest can be seen in the figure below, which shows the number of houses one could buy in cities across the U.S. for the price of just one in New York’s pricey SoHo neighborhood. For the price of one SoHo apartment (with a median value of about $3 million) one could buy 18 homes in Las Vegas, 20 in Nashville, 23 in Atlanta, 29 in Detroit, 30 in Cleveland, 34 in St. Louis, and 38 in Memphis. The disparities are even more staggering when looking at specific zip codes. That one SoHo apartment is worth as many as 50 houses in parts of Toledo and 70 houses in parts of Detroit. In one neighborhood in Mahoning County, home of Youngstown, Ohio, a SoHo apartment owner could afford more than 100 homes.
The astronomical real-estate prices of superstar cities—and the staggering gap between these prices and those of most everywhere else—are the product of the underlying motor of capitalist development: a clustering force that pulls people and resources together. Two key things cluster in cities. First, and most obviously, is firms and industries. Big, populous cities develop thriving industry clusters, like finance in New York and London, movies in LA, fashion in Milan and Paris, and technology in the Bay Area. Even more importantly, skilled and ambitious people cluster in cities.
But this process generates another force that operates in the other direction: While clustering drives growth, it also increases the competition for limited urban space. The more things cluster in a city; the more expensive its land gets. The more expensive land and housing prices become, the more people and businesses get pushed out.
This land crunch is not just a consequence of natural economic forces—that is, of limited supply in the face of surging demand. It also stems from the efforts of urban landlords and homeowners to restrict what is built, and in doing so to keep the prices of their own real-estate holdings high. Over the past several years, a growing chorus of urban economists has decried the way that NIMBY sentiment (NIMBY being an acronym for “not-in-my-back-yard”) keeps urban housing prices unnecessarily high. Traditionally, NIMBYs were concerned residents who were motivated to keep “bad” things, like prisons or waste-treatment plants, out of their own desirable neighborhoods. While there is certainly a place for neighborhood preservation and environmental conservation, NIMBYs do more than that: Well-intended or not, when they reflexively block any and all development, they preserve high housing values but put a brake on the very clustering that produced them. As the Bloomberg View writer Noah Smith put it, “It’s landlords, not corporate overlords, who are sucking up the wealth in the economy.”
The behavior of those who succumb to this temptation isn’t just selfish; it’s destructive. By limiting density and clustering, NIMBYs hold back the urban innovation that powers growth. That’s why I prefer to refer to this group not as NIMBYs—which is too benign-sounding—but as New Urban Luddites. The original Luddites, named after their semi-mythical leader Ned Ludd, took hammers to the weaving machines that were taking away their livelihoods during England’s Industrial Revolution. Over the course of the next century, though, those factories would lift living standards to higher levels than the Luddites could have ever imagined. Of course, one key difference is that the New Urban Luddites, unlike the original Luddites, aren’t poor, exploited workers. They are some of the biggest winners of winner-take-all urbanism.
This group’s desires are codified in the enormous and complex thicket of zoning laws and other land-use regulations that restrict the supply of housing in many cities. While that may not have been their original intention (much urban zoning began as an effort to keep noxious industrial operations a safe distance away from where people lived), these regulations have a negative effect on the economy. A 2015 study by two leading urban economists found that, taken together, policies that restrict housing development cost the U.S. economy roughly 9 percent of GDP per year. In 2009, they estimated that these costs worked out to $1.3 trillion.
The New Urban Luddism does not just limit the construction of new homes and apartments; it also puts an artificial cap on the further development and expansion of entire cities. Schools, sewer lines, electrical grids, and even more importantly the transit and subways required to move people around get much costlier to develop as a place grows bigger. This is why there are so few New Yorks and Londons to begin with. In many growing cities, NIMBYs effectively limit and block the investments that are required for such further scaling. Less scaling means less clustering; less clustering means lower levels of innovation and productivity. This in turn means lower economic output and smaller tax bases, which further constrain the ability for these cities to invest in urban development or to expand their redistributive policies and programs.
As counterproductive as this New Urban Luddism may be, this does not mean that the solution is to simply rid cities of all land-use regulations. On the one hand, the high cost of land in superstar neighborhoods makes it very hard, if not impossible, for the private market to create affordable housing there. Combine the high costs of land with the high costs of high-rise construction and the result is more high-end luxury housing, and very little (if any) of the truly affordable housing many of these superstar cities’ residents need. On the other hand, there is a tipping point where too much density can actually deaden neighborhoods. The world’s most innovative and creative places are not the high-rise canyons and vertical sprawl of Asian cities, but the walkable, mixed-used neighborhoods in San Francisco, New York, and London, filled with mid-rise buildings, factory and warehouse lofts, and the occasional high-rise, which enable constant mixing and interaction. What prosperous cities need is not just deregulation, but a reformed land-use system, which together with broader changes in the tax system, increased investment in transit, and a shift from single-family homes to rental housing, can help create a more sustainable and accessible version of the density that comes with clustering.
Despite these high land and housing prices, the conventional wisdom is that workers tend to be better off financially in superstar cities and tech hubs, which offer higher wages and salaries. The data on workers overall support this view. Average wages as well as the wages for each of the three main classes of workers—highly-paid knowledge workers and lower-paid blue-collar and service workers—are all higher in larger metros, being positively correlated with population size. Then, there are the additional gains that come from the “multiplier effect” of the knowledge and high-tech jobs that cluster in superstar cities, where high-paying tech jobs create additional jobs in related industries and support nearby services. Across the earnings spectrum, where there is more economic vitality, pay is better and there are more opportunities.
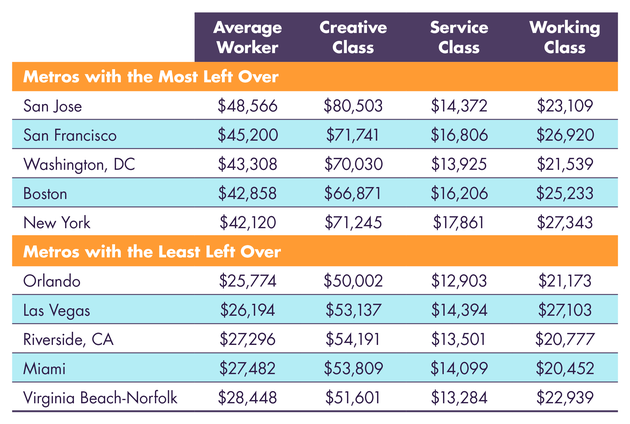
A different picture emerges when taking the higher housing costs of superstar cities into account. While the best-paid workers make more than enough to cover their increased housing costs, service workers are not so comfortable. This isn’t obvious at first glance; it is hidden by the figures for the average worker. The table below shows the top five large metro areas (those with over a million people) where the average worker has the most left over after paying for housing and the five where the average worker has the least. The top five are America’s premier tech hubs and superstar cities. The average worker in San Jose, in the heart of Silicon Valley, has $48,566 left over; in San Francisco it’s $45,200. Washington, D.C., Boston, and New York are not far behind, and workers there are left with considerably more money than the average worker in Orlando ($25,774) or Las Vegas ($26,194).
But those relatively large average figures in superstar cities are the product of the higher wages that accrue to the members of the creative class. Things look very different when the three classes of workers are broken out individually. While the average knowledge worker in San Jose has a whopping $80,503 left over after paying for housing, the average blue-collar worker has just $23,109 left over, and the average service worker ends up with just $14,372. These figures are similar to those in other superstar cities, such as San Francisco and New York.
The takeaway is clear: As innovative and productive as the economies of superstar cities may be, their most-advantaged residents haul in the majority of the gains. Given these cities’ high housing costs, their working and middle classes struggle to stay in place, and the poor and the disadvantaged fall further behind.
At a more macro scale, the exorbitant real-estate prices in superstar cities are a key factor, if not the key factor, in the staggering rise in economic inequality across the world. Thomas Piketty’s now-famous formula r > g denotes a rate of return on capital that is greater than the rate of overall economic growth, a huge driver of generational inequality. But the reality is that the outsized gains to capital have accrued more from increased real-estate values than from returns to assets such as stocks and bonds. The share of capital income derived from housing tripled between 1950 and today, according to research by the economist Matthew Rognlie, which is substantially more than the rise of any other form of capital. Simply put, people who own land and real estate in expensive cities have been capitalism’s biggest winners. Their penthouses, luxury townhomes, and other real-estate holdings amount to the visible, geographic manifestation of Piketty’s r > g.
This illuminates the central contradiction of contemporary capitalism: The clustering force is at once the main engine of economic growth and the biggest driver of inequality. The concentration of talent and economic activity in fewer and fewer places not only divides the world’s cities into winners and losers, but ensures that the winner cities will become unaffordable for all but the wealthy. This unrelenting cycle is great news for wealthy landlords and homeowners, but bad news for almost everyone else.
This article has been adapted from Richard Florida’s upcoming book, The New Urban Crisis: How Our Cities Are Increasing Inequality, Deepening Segregation, and Failing the Middle Class—and What We Can Do About It.
Related Video: