F
ScottKeesler shared a photo from Flipboard
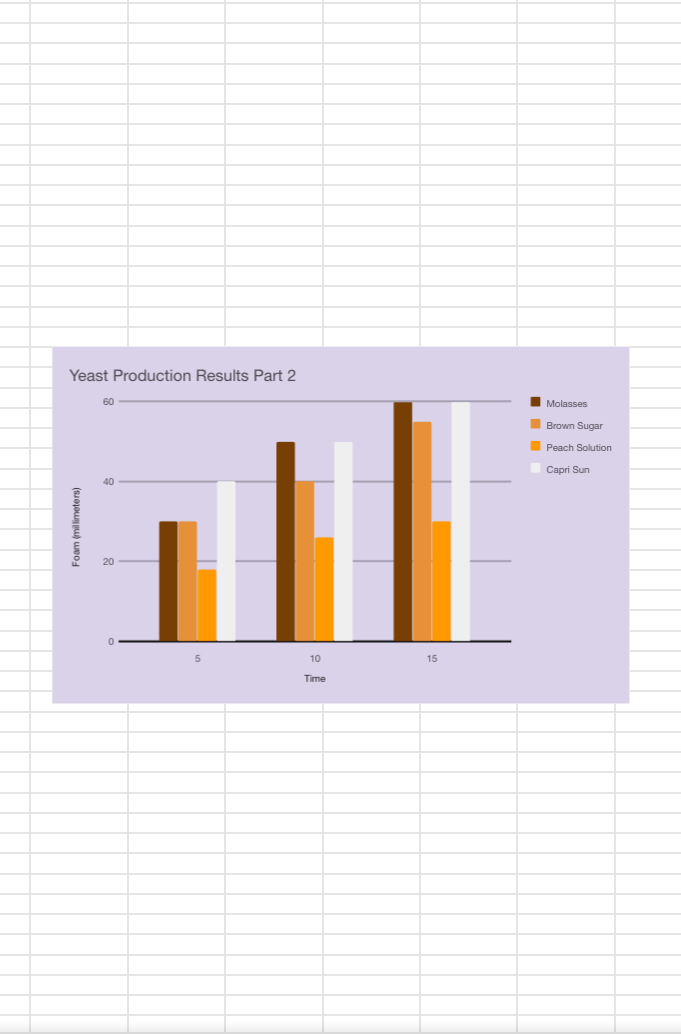
This screenshot is of a graph that I had to make to show the data that was collected in the lab. I made this graph using google sheets which I had never used before but I tried it and it came out really good and I learned how to use sheets. (New Learning/Technology Skills)
This image was shared from Flipboard,
a fast, beautiful way to flip through the news, photos and updates your
friends are sharing on Facebook, Twitter, Flickr, Google+ and
Instagram.
Free Download!
App Store Badge