1. Introduction
Methodological advancements in a research area can be defined as designs and statistical analysis of data that extend our knowledge and understanding beyond status quo. The present status of the research on the Flynn effect (FE) may be characterized as an area where the phenomenon itself has been reasonably well documented. Flynn effects have been found in a lot of nations, including industrialized countries [
1,
2], developing countries in Africa [
3,
4], and also in Latin America [
5]. FE’s have been observed in both males and females [
6], and in children [
7]. The rate of intelligence increase across generations varies between nations. In some countries, including the Scandinavian countries Norway [
8], Denmark [
9] and Sweden [
10] the secular trends have leveled out, or even reversed. Rodgers pointed out that changes in means may either be due to similar changes across the intelligence distribution, or by larger changes in some parts of the intelligence distribution [
11]. In many countries the IQ increases have been evenly distributed across the IQ distribution, whereas in some countries (Norway, Denmark, Spain), the increases have been mainly due to the disappearance of low scorers across generations. The FE seems to be most pronounced on tests measuring fluid intelligence. Additionally, the mean scores of the Similarities subtest in the Wechsler tests have shown substantial increases.
Several theories of the FE have been proposed [
12,
13], but the causes are far from clear. Causes of the FE may either reside between families or within families, or both [
11]. Between-family factors cause changes in means of groups without changes in the members within groups. For instance, changes of the relative proportions of subgroups in a population may cause changes in the intelligence means of the population at large without any changes of the means in any of the subgroups comprising the population. Within-family factors affect members of subgroups differentially. Changes in the population means in such cases are due to changes of individuals within the groups. The alleged birth order effect on intelligence is an instance of a change supposedly caused by within-family factors.
Designs and data analysis enabling us to clarify the contribution of within-families factors and between-families factors to the FE could be a valuable contribution to the understanding of the causes of this remarkable phenomenon. In the present paper, I will take a look on previously published results [
14,
15], but with some new reflections from a more methodological point of view. New analyses will also be presented.
Family data is especially well suited to study between-family and within-family factors. Family data is here defined as a data set comprising a set of target persons. Target persons are individuals with known intelligence test scores. Additionally, there is information about the siblings and parents of the target persons. Such data may be informative in many respects. In particular, the FE may be studied in various subgroups in families. We have studied how changing sibship sizes and changes of the proportions of different sibship sizes across generations affect the intelligence means in population at large [
14]. Sibship size has regularly been found to be negatively correlated with intelligence. It is of considerable interest to study the behavior of this correlation across generations, and I offer some new results relevant to this issue. Comparison of the FE in sibling pairs with the FE in the population at large has revealed important information about how the FE behaves within families compared to the FE in the general population [
15]. Previously unpublished data show that the trends found in the total sample prevail in subgroups of sibship sizes.
2. The Norwegian Data Set
The target persons in the family data set are military conscripts. In Norway, military service is mandatory for all able young men. Until recently, each man had to meet before a draft board, about one year before the actual service, where their fitness for being soldiers was assessed. Intelligence was measured by means of three tests. The Arithmetic test, presented in prose, aims to measure arithmetic and elementary algebraic ability, and is quite similar to the Arithmetic test in WAIS. The Word Similarities test (similar to the Vocabulary test in WAIS) is a synonym test. The Figures test was constructed to be similar to Raven Progressive Matrices. The test-retest reliabilities were in the 0.70–0.90 range [
8]. The contents of the Word Similarities and Figures tests have remained unchanged since the construction in 1954. The content of the Arithmetic test was modernized in 1963, and the format was changed from free format to multiple choice in the early 1990s. General Ability (GA) is based on a combination of the results on the three tests, and the GA scores are given on a stanine scale. The correlation between the GA scores and WAIS IQ has been found to be in the mid 0.70’s [
8]. Female conscripts were excluded. Most of the men were 18–20 years of age when they met before the draft board. From the Army register it was possible to retrieve GA data on about 930,000 young men tested in the period 1969–2002 (birth years 1950–1985).
Family data on the conscripts were obtained by matching the Army with files of the governmentally held Statistics Norway. In the matched file it was possible to retrieve the parents and siblings of the conscript, and information about their birth year and level of education as of 2002. In another file, we were able to retrieve intelligence data from around 50,000 in the birth cohorts 1938–1940. The data could not be matched with the Statistics Norway files, so we were not able to identify parents and siblings of the conscripts. However, the men informed about the education of their father at the conscription (except the 1938 conscripts) and the number of siblings. We were not able to retrieve conscript data in the birth years between 1940 and 1950.
Large and representative samples are always a definite advantage. Large samples secure that small effect sizes may be detected. The majority of the birth cohorts in the Norwegian family data set comprise 20,000 to 25,000 persons. Around 90% of the males eligible for military service are included in the data set. The present data set probably yields a highly representative picture of the intelligence distribution within and across generations in Norway.
All the analyses presented in this paper are based on the GA scores in stanine units. In figures and tables, the IQ equivalents of the stanine scores have been used.
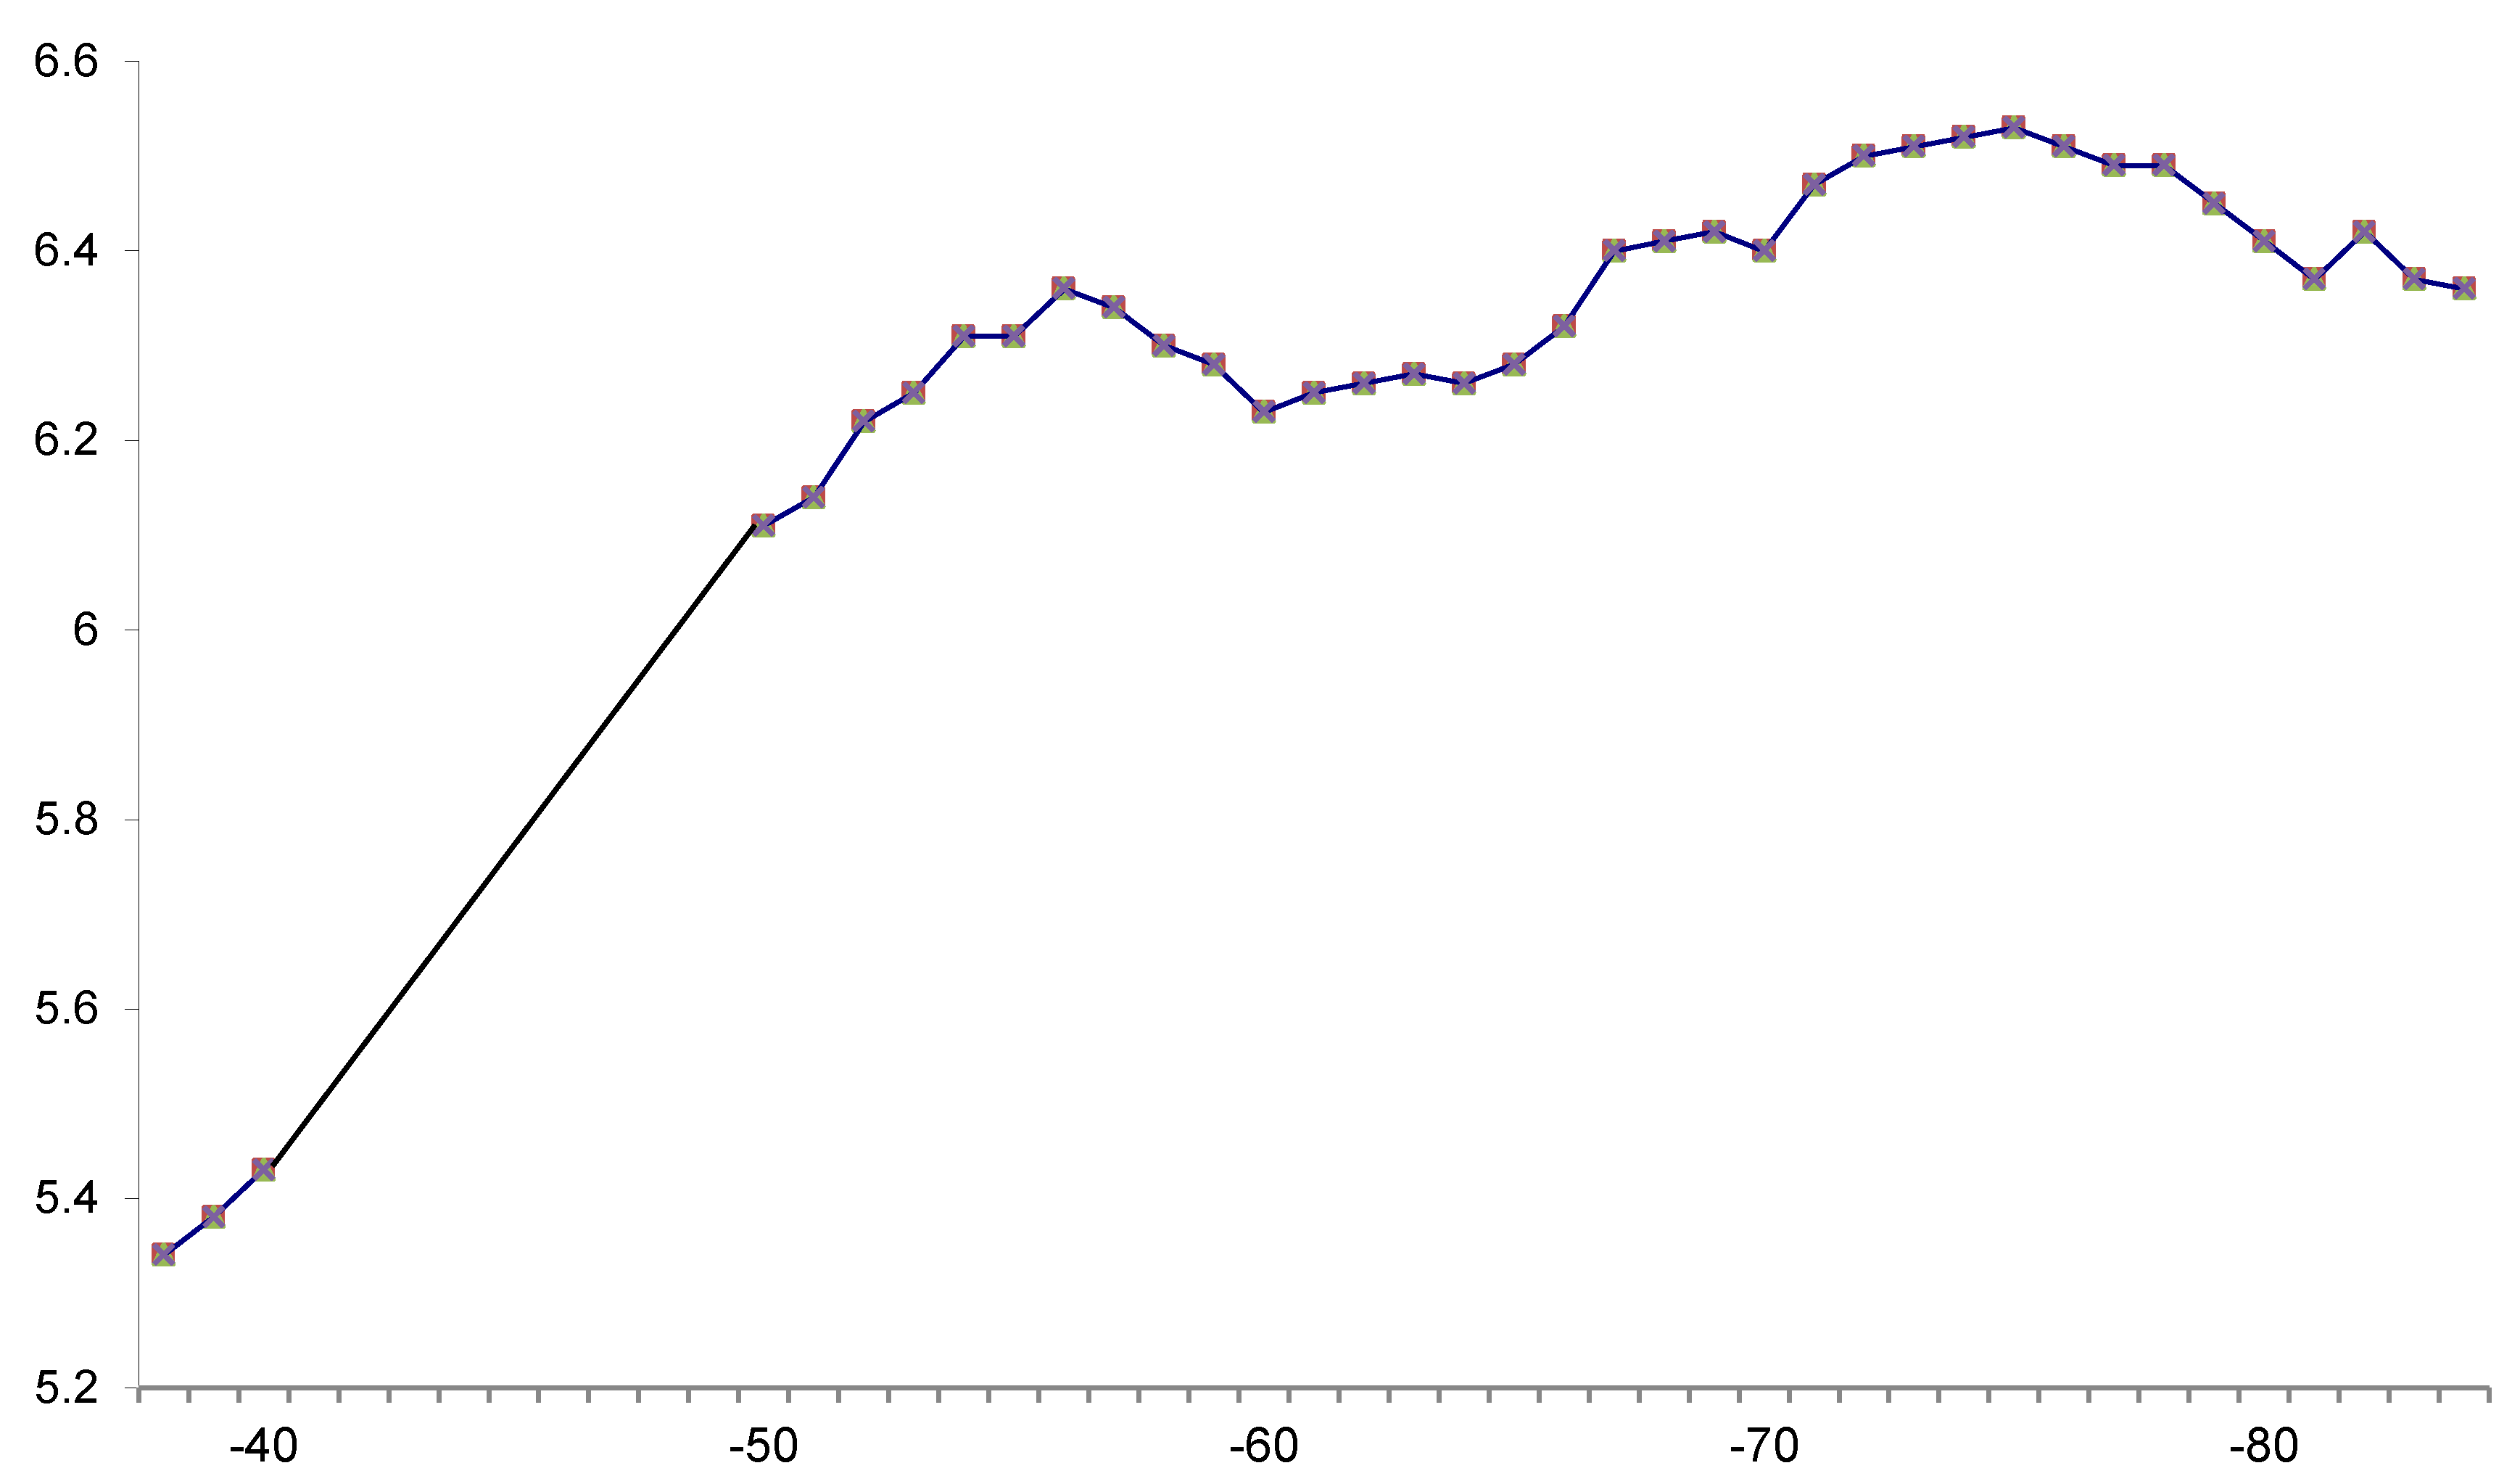
The FE in Norway for the birth cohorts from 1938–1940 and the birth cohorts 1950 through 1985 (in IQ units) is shown in
Figure 1 (intelligence test scores are given according to norms from 1954. For details see [
8]).
3. Family Data and the FE: Case 1
Studies of the FE in sibships of different sizes are interesting for at least two reasons: It is important to clarify how the FE behaves in sibships of different sizes (siblings were defined as persons with the same mother). Population means in IQ may also be influenced by the proportions of subgroups in the population. This is exactly what happens if a country experiences immigration of people with a mean IQ different from the mean IQ in the population before the immigration. The change in the mean IQ after immigration depends on the relative proportion of immigrants. The same reasoning applies to changes of the relative proportions of the different sibship sizes across generations. Given a negative correlation between sibship size and IQ, increasing proportions of small families at the expense of larger families, the mean IQ in the population at large tend to increase across generations. Of course, both IQ changes in each of the sibships, and proportion changes may contribute to changing population means.
Figure 1.
Intelligence test scores (IQ units) of military conscripts in the birth years 1938 to 1985.
Figure 1.
Intelligence test scores (IQ units) of military conscripts in the birth years 1938 to 1985.
In a paper published in 2008, we decomposed the population IQ means into means in each sibship size and the proportion of persons comprising each sibship size across birth cohorts [
14]. The aim was to study the relative importance of changing means in each sibship size and changing proportions of sibship sizes. Sibships with six or more siblings were collapsed into one group. Birth years were given in intervals of three years (1938–1940, 1950–1952,
etc.). In the 1938–1940 birth cohort groups, information about sibship size was given by the conscript. Otherwise, the size of sibships was determined by counting the number of times a mother appeared in the data file. Half-sibs were included in the data set. It is unclear whether the conscripts in the 1938–1940 birth cohorts included half-sibs. Additionally, new siblings may have been born after the conscription date. This may also be the case in some of the birth cohorts in the 1980s. Sibship sizes may thus have been underestimated in some cases. Given the conscription age (18 years+), this may not be a large problem.
The mean intelligence test scores (IQ units) across birth cohort groups in six different sibship sizes are displayed in
Table 1. All the sibship intelligence means increased towards the more recent cohorts, entailing that most of the increase of the intelligence test score means across birth cohorts are due to factors common to members of all sibship sizes. The increases of the mean intelligence test scores in the sibships comprising 1, 2 and 3 siblings were approximately 6–7 IQ points from the 1938–1940 birth cohorts to the birth cohorts where the largest means appear (1971–1973 and 1974–1976). In the sibships comprising 4 and 5 siblings, the corresponding mean increases amounted to around 7–8 IQ points in the same period. The corresponding increase the 6+ sibships was around 10 IQ points.
Table 1.
Intelligence test scores (IQ units) by conscript birth cohort group and sibship size.
Table 1.
Intelligence test scores (IQ units) by conscript birth cohort group and sibship size.
| Sibship size | 1 | 2 | 3 | 4 | 5 | 6+ |
|---|
| Cohort Group | | | | | | |
| 1938–1940 | 105.3 | 106.3 | 105.3 | 102.8 | 100.7 | 96.3 |
| 1950–1952 | 109.1 | 110.1 | 109.3 | 107.7 | 106.1 | 103.4 |
| 1953–1955 | 110.2 | 111.1 | 110.2 | 108.8 | 107.1 | 105.2 |
| 1956–1958 | 110.7 | 111.3 | 110.8 | 109.3 | 107.3 | 105.4 |
| 1959–1961 | 109.9 | 110.8 | 110.3 | 108.7 | 106.5 | 104.6 |
| 1962–1964 | 110.5 | 110.9 | 110.0 | 108.3 | 106.3 | 104.2 |
| 1965–1967 | 110.9 | 111.4 | 110.4 | 108.6 | 106.7 | 105.0 |
| 1968–1970 | 111.2 | 111.8 | 110.7 | 109.3 | 107.5 | 106.0 |
| 1971–1973 | 112.0 | 112.4 | 111.4 | 109.8 | 108.2 | 106.4 |
| 1974–1976 | 111.7 | 112.5 | 111.6 | 110.1 | 108.8 | 106.9 |
| 1977–1979 | 111.4 | 111.7 | 111.4 | 110.3 | 108.4 | 106.6 |
| 1980–1982 | 110.6 | 111.1 | 110.9 | 109.7 | 107.8 | 106.5 |
| 1983–1985 | 110.1 | 110.5 | 110.7 | 109.7 | 107.5 | 106.4 |
The largest increases in the intelligence means appeared in the 1938–1940 birth cohorts to the 1950–1952 cohorts in all sibship sizes. A similar, but slightly weaker change rate seems to appear to the mid 1950’s (
Figure 1 and
Table 1). For the more recent birth cohorts, the FE was relatively modest, but the increases tended to be somewhat larger in the larger sibships. It seems that the decreasing trends in the intelligence means in the two or three youngest cohorts were somewhat stronger in the comparatively small sibships.
The modest, but distinct trends showing differential changes of the intelligence test score means across birth cohort groups in the different sibship sizes were highly significant (p < 0.001). Possible causes of these differential changes need to be considered. I will consider some possible between-families and within-families factors.
In general, it may be difficult to ascertain that a given factor is a within-families or a between-families factor. For instance, in many studies of the alleged birth order effect on intelligence the results may be confounded by between-families factors [
16,
17]. In a similar vein, differences in intelligence means between sibship sizes may be influenced by within-families factors. The task of explaining
changes of mean intelligence in different sibship sizes across generations may be something different from explaining the effects of sibship size in ordinary cross-sectional data.
Possible and reasonable between-family factors seem ready at hand. Poverty and social differences, combined with large sibships among the poor, may lead to effects due to between-family factors. Before and during the last world war in Norway, poverty may have affected large families more than small families. The comparatively large intelligence changes in larger sibships from the late 1930s to the early 1950s may reflect the transformation of the Norwegian society from the hardships of the 1930s and the Nazi occupation during the war to a relatively well-off society with comparatively small social differences in the generations after the war. Better nourishment and free health care and improved schools might have benefited children in large families more than children in small families. Possible within-families factors may have been poorer nutrition and less parental care for the later-born children in large families in the pre-war birth cohorts. It may also be a factor that the mean number of children in the 6+ sibship was slightly larger in the 1938–1940 birth cohorts than in the 1950–1952 birth cohorts (6.9 and 7.7, respectively). Seen together, these factors may partly be responsible for the fact that much of the FE in occupied Norway and Denmark was due to the disappearance of low-scorers [
8,
9].
Increasing proportions of persons comprising comparatively small sibship sizes at the expense of large siships, which clearly is a between-families factor, accounted for about 20% of the FE from the prewar cohorts to the cohorts born in the early fifties. After that, proportion changes did not influence the IQ means appreciably. Thus, changes in the distribution of sibship sizes had a distinct but relatively modest effect about seven decennia ago, but not in the postwar generations, at least not in Norway. This may also be the case in many other industrialized countries. Family size in non-industrialized countries may change substantially when they become increasingly more affluent. Eradication of common childhood diseases and active birth control are both factors that may work in that direction. Flynn [
13] has proposed that the FE may have started with the industrialization. If so, changes in the distribution of sibship sizes may have contributed substantially to FE in earlier generations.
Non-zero heritability combined with negative correlations between sibship size and IQ may deflate IQ means in a population. This may happen because parents with low IQ’s tend to have larger families than high-IQ parents. Lynn [
18] and others have posited that such regularities may lead to so-called dysgenic trends (but see [
19]). Previously unpublished correlations between the IQ of the conscripts and the size of the sibship (siblings defined as persons with the same mother) across birth cohorts are shown in
Figure 2 (the correlation between parental education and sibship size showed similar trends). The classification of sibship size and the birth cohort categories were identical to those in
Table 1. Some of the conscripts (more than 100,000) were fathers of sons who also had been drafted and had IQ scores. Most of the sons were born in the 1970s and 1980s. Fathers may appear more than once in the data file. I have calculated the correlation between father IQ and sibship size both in the file with conscripts as records and in an aggregated file where fathers appeared only once. The correlation between the fathers IQ and sibship size was practically identical and slightly positive (around 0.02) in both files.
The first thing to note is the substantial decrease of the correlations between the conscript IQ and sibship size across birth cohorts. Indeed, this correlation approached zero in the most recent cohorts. Restriction of range may pose a problem in the interpretation of the pattern of correlations in
Figure 2. The standard deviations of sibship size decreased across birth cohorts. In the oldest birth cohort, it was 1.6, sinking to 1.3 to 1.1 in the birth cohorts in the early 1950s to the late 1960s. In the rest of the birth cohorts, the standard deviations were largely between 1.07 and 1.02. Some of the reduction in the correlation from the birth cohorts 1938–1940 to the cohorts in the 1950s and late 1960s may be due to restriction of range. However, the decreases of the correlations from the early 1970s are probably not exclusively be due to restriction of range. The correlation between father IQ and sibship size, and the trends towards convergence of intelligence test scores means in different sibship sizes (
Table 1) may support the contention that the negative correlations between IQ and sibship size may have been decreasing.
Figure 2.
Correlations between conscripts intelligence test scores and sibship size across birth cohort groups.
Figure 2.
Correlations between conscripts intelligence test scores and sibship size across birth cohort groups.
4. Family Data and FE: Case 2
With notable exceptions, the possible contributions of genetic factors to the Flynn effect have largely been disregarded. Dickens and Flynn [
20] introduced gene-environment correlations to account for the combination of a substantial heritability of intelligence and increasing means across generations. The argument for excluding genes is that the time spans are too narrow for changes in the genetic pool of a population. This may be true but it does not exclude the possibility that the relative frequencies of homozygous and heterozygous genotypes in a population may change across generations. Mingroni [
21,
22] proposed that changes in the degree of inbreeding may have changed. Inbreeding occurs when males and females, who are biologically related, mate and produce offspring. Inbreeding increases the probability of malformations and diseases. In addition, inbreeding depression may affect the mean IQ [
23]. When the mating practices in a group changes from marrying biologically related persons to marrying unrelated persons, the effects of unfortunate effects of inbreeding should subside an eventually disappear, and a heterosis (also called hybrid vigor) effect will occur, implying that the IQ mean in the previously inbreeding group should be expected to increase.
Inbreeding is a pure between-families factor. This is so because potential inbreeding only affect the parents, while the offspring is not differentially affected. Consider a population where the mean IQ increases across generations. If the heterosis hypotheses is strictly correct, we should expect that the mean IQ of the offspring should (disregarding the birth order effect), on the average, be the same for earlier-born offspring and for later-born offspring. Thus, the heterosis hypotheses cannot explain results showing that the IQ difference between later-born and earlier-born siblings is similar to the difference between IQ means in the population at large. Indeed, if the IQ differences between later-born and earlier-born siblings more or less mirror the FE in the population at large, the heterosis hypothesis is substantially weakened as a possible explanation of FE.
To test this prediction family data is needed. We need to be able to identify the birth order in a sibship to pinpoint who is earlier-born and later-born sibling and the age of the siblings to find out how the IQ increase from one sibling to the next with a given age distance compares to the IQ change in the general population in a corresponding time interval. Two different data files are needed for these analyses. One of them has the data on each conscript as records. In this file we can study the course of the mean IQ across birth years. In the other file brother pairs are the records. The point is that we can compare the IQ change from one birth year to the next and compare that change with the difference between the IQ scores between brothers being born one year apart, two years apart,
etc. We performed this kind of analyses some years ago [
15].
FE shows a somewhat irregular course in Norway (see
Figure 1). There are increasing trends from the birth cohorts in the late 1930s to the mid 1950s. Unfortunately it was not possible to identify brothers in the 1938–1940 birth cohorts, so the analyses were limited to the birth cohorts from 1950 to 1985. It may be seen from
Figure 1 that the IQ means increased in the period from 1950–1956. From 1960 to 1965 there was virtually no change of the mean GA scores, and from 1976 to 1983 there was a slight decrease. In each of the three periods the trends of FE were approximately linear, and could be analyzed by standard regression analyses with birth year as the independent variable and IQ scores as the independent variable. The unstandardized regression coefficients (stanine units) in the three periods turned out to be 0.042, (about 0.32 IQ points per year), close to zero, and −0.024 (about 0.18 IQ points decrease per year), respectively.
The brother file comprised all possible brother pairs in the conscript group. The brother file comprises persons born between 1950 and 1985, inclusive. In the brother file the relevant variables is the relationship between the age difference between the two members of brother pairs and the IQ difference between them (brothers defined as males with the same mother. Excluding brothers with different fathers did not change the results appreciably). If the heterosis hypothesis is valid, it should be expected that the IQ differences are unaffected by the FE in all three periods, i.e., that the IQ differences should be unaffected by the age differences between members of brother pairs. This turns out not to be the case. The IQ difference between brothers was influenced both by the direction and the magnitude of the FE. Thus, the IQ differences between a later-born and an earlier-born brother was clearly smaller in the period of increasing IQ means in the population of conscripts than in the period of a non-existent FE and the period with a “negative” or “reversed” FE. The magnitude of the IQ differences decreased as the age differences increased in the 1950–1956 period and increased with increasing age in the period 1976–1983. In the period with no FE, there were essentially no effects of age differences on the IQ differences. Regressing IQ differences on age differences enable a direct comparison between the unstandardized regression coefficients obtained in the two files. They turned out to be similar. In the 1950-1956 birth cohorts the IQ difference between the latest-born brother and the earlier-born brother was 0.034 (approximately 0.26 IQ points), and −0.025 in the 1976–1983 cohorts (approximately 0.19 IQ points). The difference between the regressions coefficients in the conscript and brother file was non-significant. In the 1960–1965 period there were no significant effects of age distance on intelligence differences between brothers.
The main impression is that the changes in the mean IQ score when the birth year increases by one year is quite similar to the changes (or lack of changes) in the IQ difference between brothers per year of age difference. In the group of male conscripts in general, the mean intelligence test scores in each birth cohort comprises the test results of persons that belong to sibships of different sizes. The fact that the rate of change of the IQ means in the subgroup of brothers born in consecutive years more or less mirrors the change across consecutive birth years in the conscription group in general shows that the IQ changes of members of the same family may be influenced by the same factors that cause IQ changes across birth cohorts in the general population.
Additional (previously unpublished) analyses reveal that similar regularities also occur in subgroups.
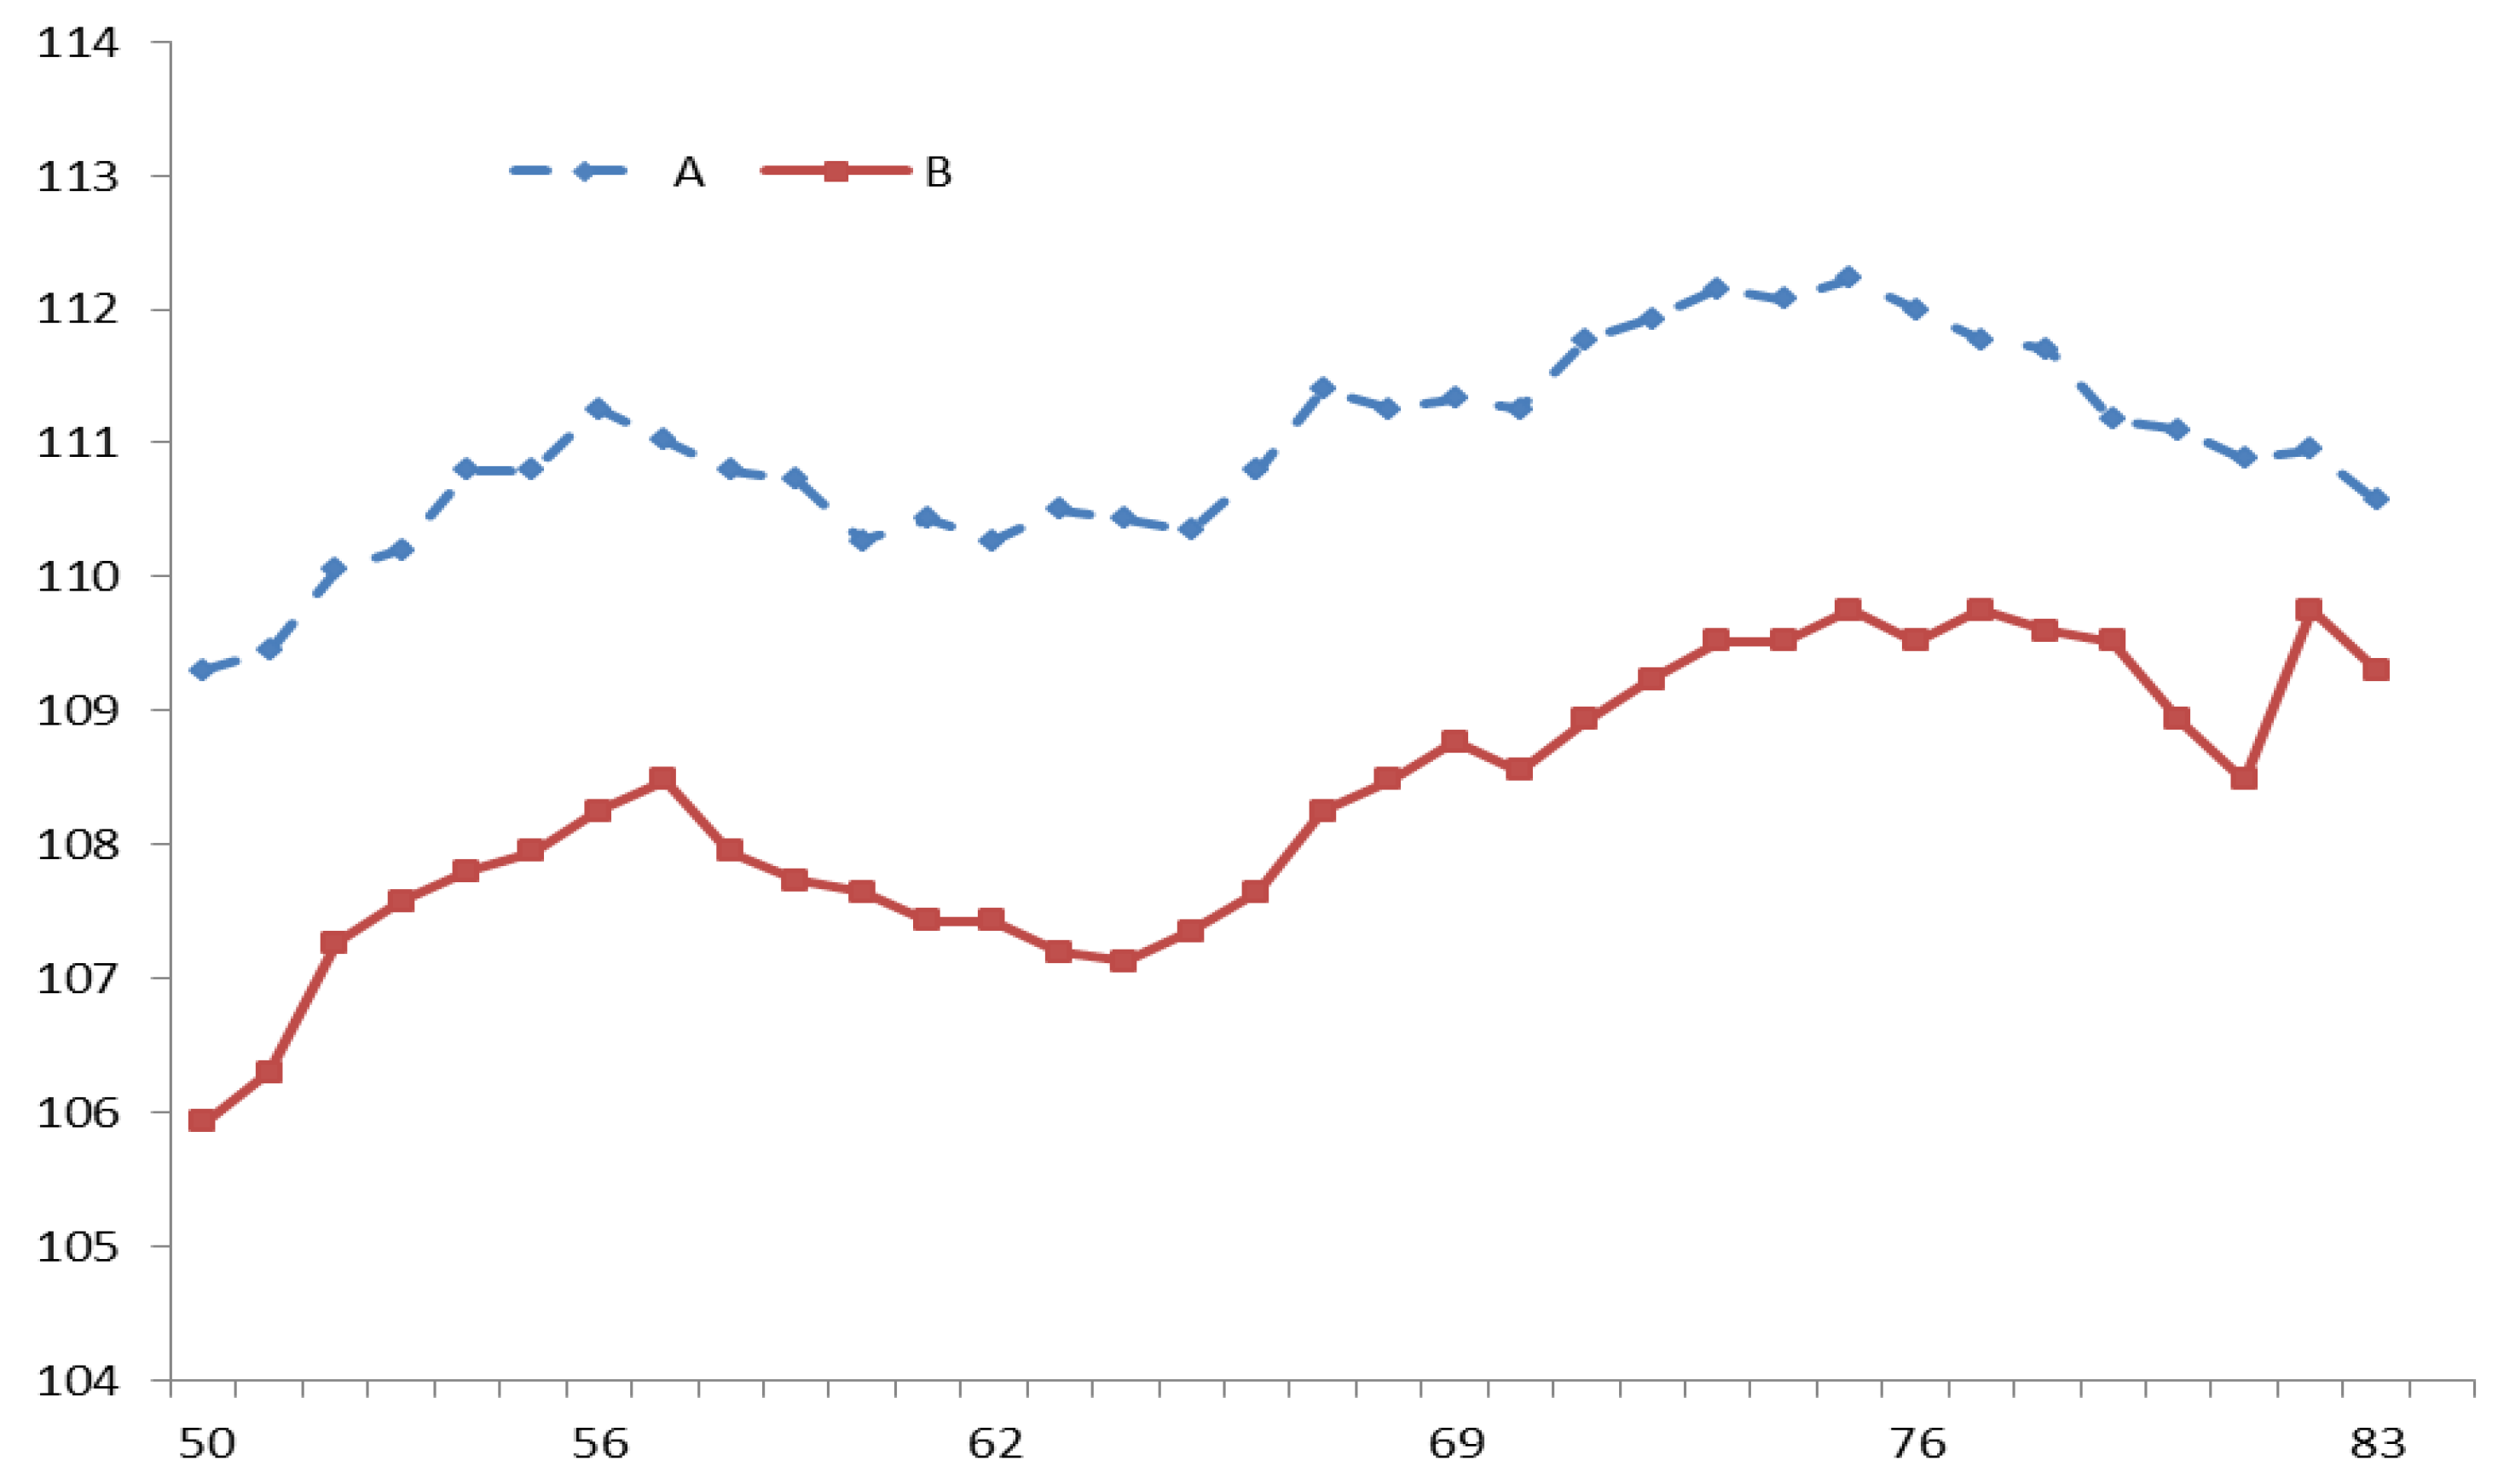
Figure 3 shows the mean intelligence test scores in two different sibship sizes (≤3 siblings and ≥4 siblings) across birth years. We have compared the trends in families with three or less siblings with families with four or more siblings. These trends in IQ means were quite similar in the two subgroups in the 1950–1956 period. Regressing IQ scores on birth year yield unstandardized regression coefficients of 0.044 and 0.050 for the smaller sibship group and the larger sibship group, respectively. In the 1960–1965 birth cohorts the regression coefficients were close to zero in both sibship size groups (–0.01 and 0.002). The magnitude of the decrease in the mean IQ was, except for the 1981 birth cohort, smaller in the larger than in the smaller sibships. The regression coefficients also were different; −0.026 in the small sibship group and −0.009 in the large sibship group. The difference between these regression coefficients was highly significant (
p < 0.001). The regression coefficients in the 1950–1956 cohorts and 1960–1965 cohorts were quite similar to the regression coefficients in the file comprising all sibship sizes (0.042 and 0.001, respectively). In the 1976–1983 cohorts, the regression coefficient in ≤3 sibship size group was a little larger than in the file comprising all sibship sizes (−0.024), whereas it was somewhat smaller in the ≥4 sibship size group.
Figure 3.
Intelligence test scores (IQ units) by conscript birth year and sibship size. (Series A: ≤ 3 sibs, series B: ≥ 4 sibs).
Figure 3.
Intelligence test scores (IQ units) by conscript birth year and sibship size. (Series A: ≤ 3 sibs, series B: ≥ 4 sibs).
In the brother file, comprising all brother pairs, the unstandardized regression coefficients in the 1950–1956 for the smaller and larger sibship groups were quite similar to each other (0.038 and 0.035, respectively), and also similar to the corresponding regression coefficients in the file with the conscripts as records. In contrast, the (unstandardized) regression coefficient in the 1976–1983 birth cohorts in the smaller sibships was significantly different (p < 0.01) from the regression coefficient in the larger sibships (−0.035 and −0.002, respectively). Again, the regression coefficients were similar to the corresponding coefficients in the file with conscripts as records. The regression coefficients in the 1960–1965 cohort groups were small and far from significance (−0.012 in the ≤3 sibship group and −0.014 in the ≥4 sibship group). In the brother file, the regression coefficients in the two sibship size groups in the 1950–1956 cohorts and the 1960–1965 cohorts were close to the ones found in the file comprising all sibship sizes (0.034 and −0.014, respectively).
These results are important. They clearly show that factors like heterosis due to reduced inbreeding seem to be considerably weakened as potential causal mechanisms. Flynn (13) argues that high mobility among the citizens in USA through the last 125 years or so more or less excludes heterosis as a factor in FE. It remains to see what happens to the FE if and when cultures where marriages between biologically related individuals still are quite common change their habits towards marriages between genetically unrelated persons. Inbreeding is only one of many between-families factors. I have already mentioned changing proportions of different sibship sizes. In general, changing proportions of subgroups with different mean IQ’s may change the IQ means in the whole population. Possible dysgenic trends are also caused by between-family factors. Comparison of secular trends of intelligence test scores in the general population with the trends in the differences between siblings seems to be a quite general method eminently suited to investigate the relative importance of between-families and within-families factors.
In summary, both changes in the relative proportions of different sibship sizes and differential changes of intelligence test scores in each of the sibships may have been between-families factors contributing to the increasing means in the population at large from the pre-war birth cohorts to the early post-war birth cohorts. Unknown factors common to all sibship sizes also seem to have been involved. The situation may have changed in the post-war birth cohorts. The results in the brother file strongly indicate that between-families families have little or no impact on the changes of the intelligence test scores in the post-war birth cohorts. It may, however, be of some interest to note that in the 1950–1956 birth cohorts the regression coefficient found in the brother file was somewhat smaller (but not significantly so) than the one found in file comprising conscripts as records. Perhaps some between-families factors working in the pre-war birth cohorts had some small influence in the early 1950s as well.
FE and the alleged birth order effect of IQ scores [
24,
25] have usually been treated as separate phenomena. The results from the analyses in the brother file show that they are quite intimately connected, at least in Norway. The fact that the IQ difference between brothers closely follows the trends in the general conscript group, thus, implies that the magnitude of the birth order effect is contingent of the secular trends of IQ means in the population. Our analysis of the IQ scores of the first-born and the second-born brother shows this quite clearly [
15]. In the period of increasing means (birth years 1950–1956) the mean IQ difference between brothers was 1.5 IQ points. Through the period of decreasing means (1976–1983) this difference amounted to 2.7 IQ points. The IQ difference between the first-born and the second-born in the 1960–1965 birth years (no FE) was around 2 IQ points. This difference may be seen as a sort of “basic” birth order effect, occurring in countries/time periods without FE. Extrapolating the results from the 1950–1956 period, it is a perfectly reasonable conjecture that the birth order effect could have disappeared completely, and even reverse it. An immediate implication of these results is that the magnitude of the birth order effect should be seen in connection with FE. It follows that the both the existence and magnitude of the birth order effect may vary across societies and time periods. The brother data also shows that the magnitude of the birth order effect for the first two first-born brothers is influenced by the age difference between brothers [
15].
I also calculated the IQ difference between the first-born and the second-born (birth order effect) in the two subgroups comprising sibships ≤3 siblings and ≥4 siblings in the 1976–1983 birth cohorts. The birth order effects turned out to be 2.8 IQ points in the smaller sibhips and 2.1 in the larger sibships. In the 1960–1965 birth cohorts, the IQ difference between the two first-born brothers (the “basic” birth effect) was around 1.9 IQ points in both sibship size groups. These values are almost identical to the one found in the 1960-1965 birth cohorts comprising all sibship sizes [
15]. In the 1950–1956 cohorts the birth effect was 1.5 and 1.3 IQ points in the smaller and larger sibship groups, respectively.
Further analyses of the data in the family data set may of course be done. Data on the parental education are available for all the birth cohorts (except the 1938 birth cohort). For conscripts and siblings, educational data (from 2002) are available for is available from the 1950 birth cohort. Data on occupation and income are also available in these cohorts. Further analyses of birth order effects may also be done.


