Your camera has numerous ways of giving you feedback about the content of a shot, but perhaps nothing is more useful than the histogram. This helpful video will show you what a histogram is and how to read it to ensure you're getting the best possible shots.
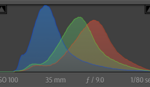
Coming to you from Nathaniel Dodson of tutvid, this video explores the histogram and how to read it. The histogram is really nothing more than a bar graph of the proportional tonal distribution of an image. In other words, it tells you how many pixels are in the blacks, shadows, mid-tones, highlights, and whites. They can be very useful for two reasons: first, by examining the extreme edges of the graph, you can tell if you've clipped the shadows or highlights. Second, you can see where the bulk of your exposure lies, so if you're trying to maximize the useful data you get, you can push the exposure more to the right. One thing to note: if you're shooting raw, know that the histogram you see on the back of your camera is an approximation (though a pretty good one), so give yourself just a little wiggle room if you're really pushing things to the edge.