

Energy Shift
How Old Are the World’s Nuclear Reactors?


How Old Are the World’s Nuclear Reactors?
Since the advent of nuclear electricity in the 1950s, nuclear reactors have played an essential role in meeting our rising energy needs.
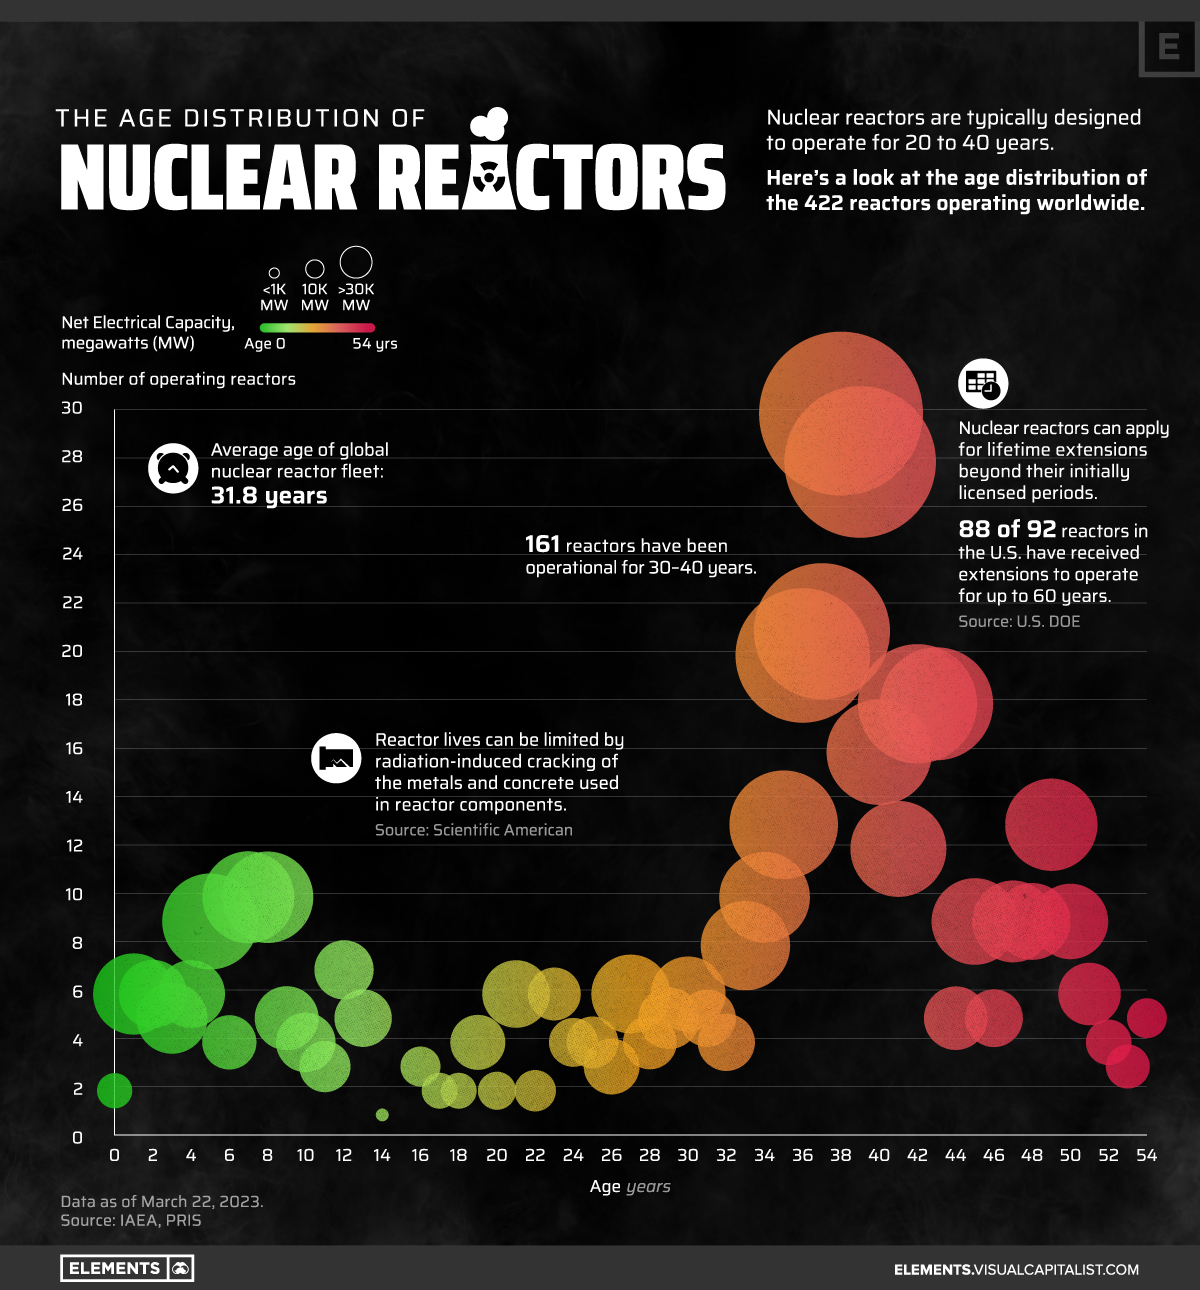
Nuclear reactors are designed to operate for decades and are typically licensed for 20 to 40 years, and they can last even longer with license renewals.
So, just how old is the world’s current nuclear reactor fleet?
The bubble chart above looks at the age distribution of the 422 reactors operating worldwide as of March 2023, based on data from the Power Reactor Information System (PRIS).
The Age Distribution of the Global Reactor Fleet
Nuclear power saw a building boom in the 1970s, 80s, and 90s as countries expanded their energy portfolios and sought to capitalize on the advancements in nuclear technology. As a result, the majority of the world’s nuclear reactors began operating during this period.
| Age Group (years) | Number of Reactors | Net Electrical Capacity (megawatts) |
|---|---|---|
| 0–10 | 67 | 66,937 |
| 11–20 | 29 | 20,964 |
| 21–30 | 46 | 40,905 |
| 31–40 | 155 | 149,638 |
| 41–50 | 107 | 88,526 |
| >50 | 18 | 10,921 |
| Total | 422 | 377,891 |
Data as of March 22, 2023.
Of the total of 422 reactors, 262 reactors have been in operation for 31 to 50 years. In other words, about 62% of all current nuclear reactors were connected to the grid between 1973 and 1992.
Nuclear power’s growth slowed down at the turn of the 21st century, with decreasing public support and increasing concern over nuclear safety. As a result, only a small number of reactors fall into the 11-to-20-year-old age group.
But over the last decade, some countries have renewed their interest in nuclear energy, while others like China have continued to expand their reactor fleets. Some 67 reactors are between zero and 10 years old, accounting for 18% of global nuclear electrical capacity.
The oldest operating reactors (five of them) are 54 years old and entered commercial service in 1969. Two of these are located in the United States, two in India, and one in Switzerland.
How Long Can Nuclear Reactors Last?
Although specific lifespans can vary, nuclear reactors are typically designed to last for 20 to 40 years.
However, reactors can operate beyond their initially licensed periods with lifetime extensions. Extending reactor lives requires rigorous assessments, safety evaluations, and refurbishments.
Some countries have granted license renewals for aging reactors. Notably, 88 of the 92 reactors in the U.S. have received approvals to operate for up to 60 years, and some have applied for additional 20-year extensions to operate for up to 80 years.
With safety concerns addressed, reactors with lifetime extensions can offer various advantages. Without the high capital investments needed to build new reactors, they can produce carbon-free electricity at low and competitive costs, which is especially important as the global power sector looks to decarbonize.


Energy Shift
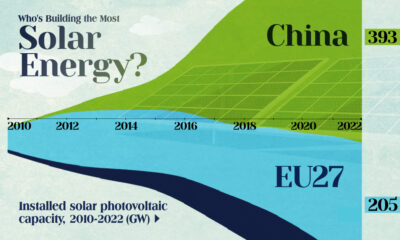
Who’s Building the Most Solar Energy?
China’s solar capacity triples USA, nearly doubles EU.

Who’s Building the Most Solar Energy?
This was originally posted on our Voronoi app. Download the app for free on iOS or Android and discover incredible data-driven charts from a variety of trusted sources.
In 2023, solar energy accounted for three-quarters of renewable capacity additions worldwide. Most of this growth occurred in Asia, the EU, and the U.S., continuing a trend observed over the past decade.
In this graphic, we illustrate the rise in installed solar photovoltaic (PV) capacity in China, the EU, and the U.S. between 2010 and 2022, measured in gigawatts (GW). Bruegel compiled the data..
Chinese Dominance
As of 2022, China’s total installed capacity stands at 393 GW, nearly double that of the EU’s 205 GW and surpassing the USA’s total of 113 GW by more than threefold in absolute terms.
| Installed solar capacity (GW) | China | EU27 | U.S. |
|---|---|---|---|
| 2022 | 393.0 | 205.5 | 113.0 |
| 2021 | 307.0 | 162.7 | 95.4 |
| 2020 | 254.0 | 136.9 | 76.4 |
| 2019 | 205.0 | 120.1 | 61.6 |
| 2018 | 175.3 | 104.0 | 52.0 |
| 2017 | 130.8 | 96.2 | 43.8 |
| 2016 | 77.8 | 91.5 | 35.4 |
| 2015 | 43.6 | 87.7 | 24.2 |
| 2014 | 28.4 | 83.6 | 18.1 |
| 2013 | 17.8 | 79.7 | 13.3 |
| 2012 | 6.7 | 71.1 | 8.6 |
| 2011 | 3.1 | 53.3 | 5.6 |
| 2010 | 1.0 | 30.6 | 3.4 |
Since 2017, China has shown a compound annual growth rate (CAGR) of approximately 25% in installed PV capacity, while the USA has seen a CAGR of 21%, and the EU of 16%.
Additionally, China dominates the production of solar power components, currently controlling around 80% of the world’s solar panel supply chain.
In 2022, China’s solar industry employed 2.76 million individuals, with manufacturing roles representing approximately 1.8 million and the remaining 918,000 jobs in construction, installation, and operations and maintenance.
The EU industry employed 648,000 individuals, while the U.S. reached 264,000 jobs.
According to the IEA, China accounts for almost 60% of new renewable capacity expected to become operational globally by 2028.
Despite the phasing out of national subsidies in 2020 and 2021, deployment of solar PV in China is accelerating. The country is expected to reach its national 2030 target for wind and solar PV installations in 2024, six years ahead of schedule.
Energy Shift
The World’s Biggest Oil Producers in 2023
Just three countries accounted for 40% of global oil production last year.

The World’s Biggest Oil Producers in 2023
This was originally posted on our Voronoi app. Download the app for free on iOS or Android and discover incredible data-driven charts from a variety of trusted sources.
Despite efforts to decarbonize the global economy, oil still remains one of the world’s most important resources. It’s also produced by a fairly limited group of countries, which can be a source of economic and political leverage.
This graphic illustrates global crude oil production in 2023, measured in million barrels per day, sourced from the U.S. Energy Information Administration (EIA).
Three Countries Account for 40% of Global Oil Production
In 2023, the United States, Russia, and Saudi Arabia collectively contributed 32.7 million barrels per day to global oil production.
| Oil Production 2023 | Million barrels per day |
|---|---|
| 🇺🇸 U.S. | 12.9 |
| 🇷🇺 Russia | 10.1 |
| 🇸🇦 Saudi Arabia | 9.7 |
| 🇨🇦 Canada | 4.6 |
| 🇮🇶 Iraq | 4.3 |
| 🇨🇳 China | 4.2 |
| 🇮🇷 Iran | 3.6 |
| 🇧🇷 Brazil | 3.4 |
| 🇦🇪 UAE | 3.4 |
| 🇰🇼 Kuwait | 2.7 |
| 🌍 Other | 22.8 |
These three nations have consistently dominated oil production since 1971. The leading position, however, has alternated among them over the past five decades.
In contrast, the combined production of the next three largest producers—Canada, Iraq, and China—reached 13.1 million barrels per day in 2023, just surpassing the production of the United States alone.
In the near term, no country is likely to surpass the record production achieved by the U.S. in 2023, as no other producer has ever reached a daily capacity of 13.0 million barrels. Recently, Saudi Arabia’s state-owned Saudi Aramco scrapped plans to increase production capacity to 13.0 million barrels per day by 2027.
In 2024, analysts forecast that the U.S. will maintain its position as the top oil producer. In fact, according to Macquarie Group, U.S. oil production is expected to achieve a record pace of about 14 million barrels per day by the end of the year.

-

 Electrification3 years ago
Ranked: The Top 10 EV Battery Manufacturers
-

 Electrification2 years ago
The Key Minerals in an EV Battery
-

 Real Assets3 years ago
The World’s Top 10 Gold Mining Companies
-

 Misc3 years ago
All the Metals We Mined in One Visualization
-

 Energy Shift2 years ago
What Are the Five Major Types of Renewable Energy?
-

 Electrification2 years ago
Mapped: Solar Power by Country in 2021
-

 Electrification2 years ago
The World’s Largest Nickel Mining Companies
-

 Misc3 years ago
The Largest Copper Mines in the World by Capacity