Travel
How People Get Around in America, Europe, and Asia
![]() See this visualization first on the Voronoi app.
See this visualization first on the Voronoi app.

How People Get Around in America, Europe, and Asia
This was originally posted on our Voronoi app. Download the app for free on iOS or Android and discover incredible data-driven charts from a variety of trusted sources.
This chart highlights the popularity of different transportation types in the Americas, Europe, and Asia, calculated by modal share.
Data for this article and visualization is sourced from ‘The ABC of Mobility’, a research paper by Rafael Prieto-Curiel (Complexity Science Hub) and Juan P. Ospina (EAFIT University), accessed through ScienceDirect.
The authors gathered their modal share data through travel surveys, which focused on the primary mode of transportation a person employs for each weekday trip. Information from 800 cities across 61 countries was collected for this study.
North American Car Culture Contrasts with the Rest of the World
In the U.S. and Canada, people heavily rely on cars to get around, no matter the size of the city. There are a few exceptions of course, such as New York, Toronto, and smaller college towns across the United States.
| Region | 🚗 Cars | 🚌 Public Transport | 🚶 Walking/Biking |
|---|---|---|---|
| North America* | 92% | 5% | 4% |
| Central America | 23% | 42% | 35% |
| South America | 29% | 40% | 31% |
| Northern Europe | 48% | 29% | 24% |
| Western Europe | 43% | 24% | 34% |
| Southern Europe | 50% | 24% | 25% |
| Eastern Europe | 35% | 40% | 25% |
| Southeastern Asia | 44% | 43% | 13% |
| Western Asia | 43% | 28% | 29% |
| Southern Asia | 22% | 39% | 39% |
| Eastern Asia | 19% | 46% | 35% |
| World | 51% | 26% | 22% |
Note: *Excluding Mexico. Percentages are rounded.
As a result, North America’s share of public transport and active mobility (walking and biking) is the lowest amongst all surveyed regions by a significant amount.
On the other hand, public transport reigns supreme in South and Central America as well as Southern and Eastern Asia. It ties with cars in Southeastern Asia, and is eclipsed by cars in Western Asia.
As outlined in the paper, Europe sees more city-level differences in transport popularity.
For example, Utrecht, Netherlands prefers walking and biking. People in Paris and London like using their extensive transit systems. And in Manchester and Rome, roughly two out of three journeys are by car.


Markets
Ranked: The World’s Top Flight Routes, by Revenue
In this graphic, we show the highest earning flight routes globally as air travel continued to rebound in 2023.
The World’s Top Flight Routes, by Revenue
This was originally posted on our Voronoi app. Download the app for free on iOS or Android and discover incredible data-driven charts from a variety of trusted sources.
In 2024, a record 4.7 billion people are projected to travel by air—200 million more than in 2019.
While revenues surged to an estimated $896 billion globally last year, airlines face extremely slim margins. On average, they made just $5.44 in net profit per passenger in 2023. Today, the industry faces pressures from high interest rates, supply chain woes, and steep infrastructure costs.
This graphic shows the highest earning flight routes worldwide, based on data from OAG.
The Top Revenue-Generating Routes in 2023
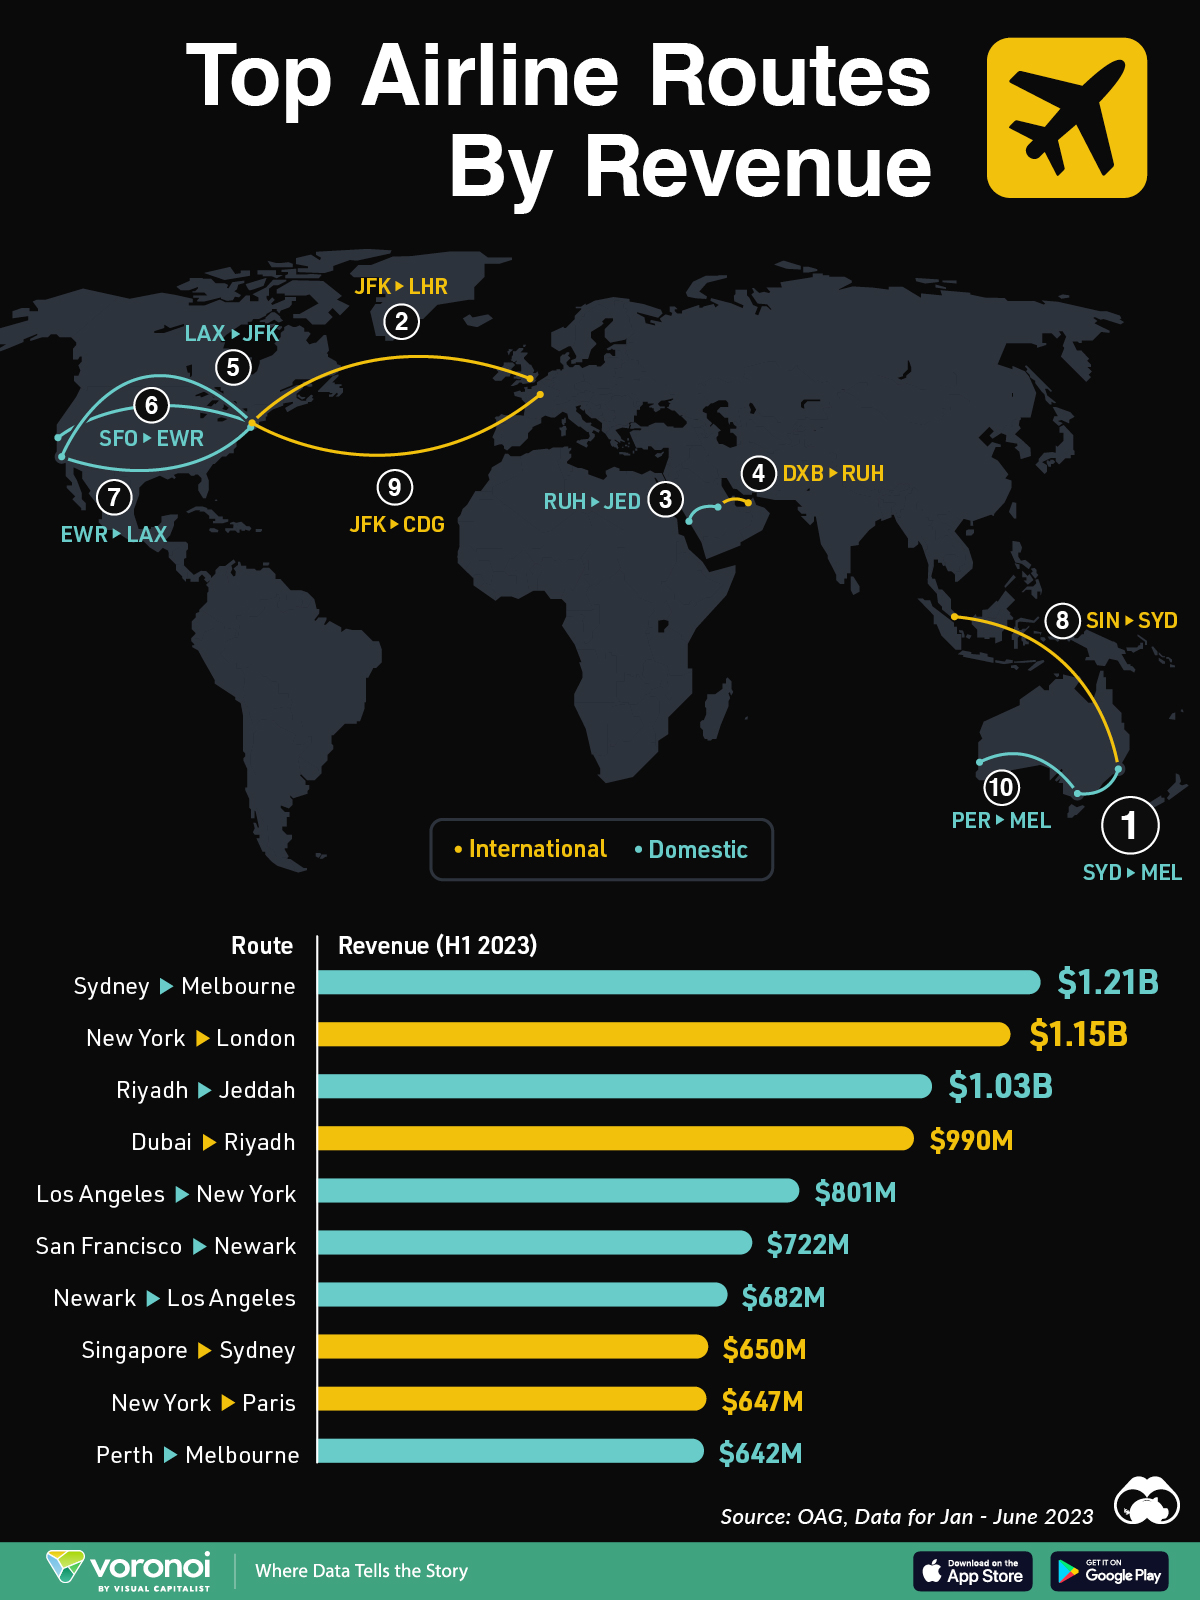
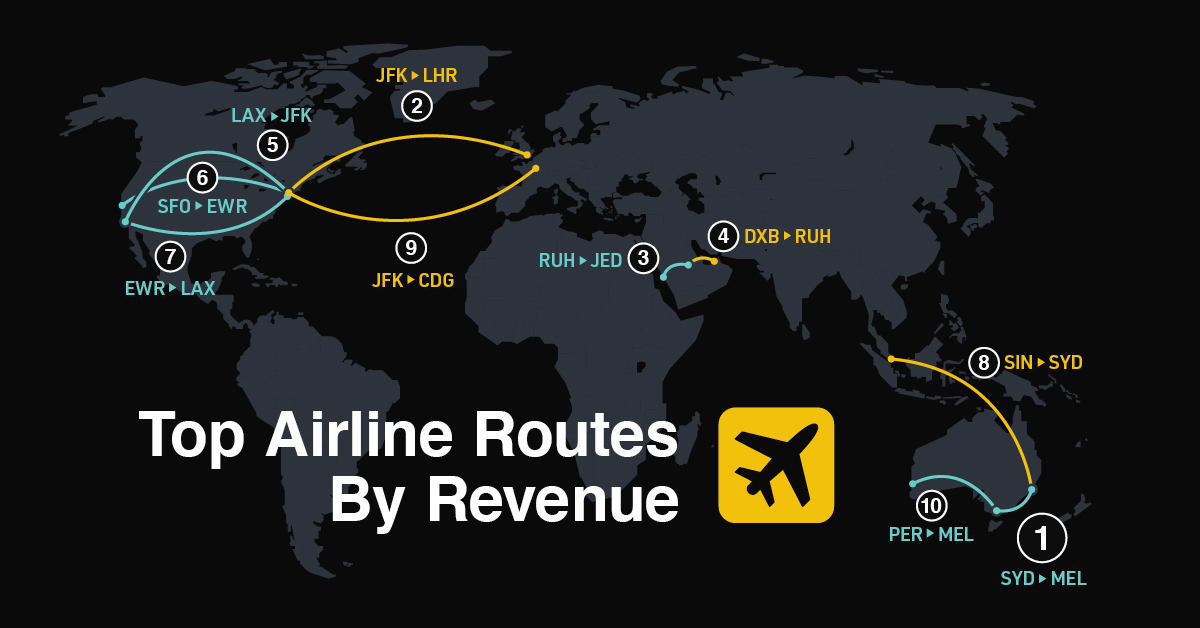
Below, we show the airline routes with the highest revenues in the first half of 2023:
| Route | Airport Codes | Revenue H1 2023 |
|---|---|---|
| Sydney to Melbourne | SYD-MEL | $1.21B |
| New York to London | JFK-LHR | $1.15B |
| Riyadh to Jeddah | RUH-JED | $1.03B |
| Dubai to Riyadh | DXB-RUH | $990M |
| Los Angeles to New York | LAX-JFK | $801M |
| San Francisco to Newark | SFO-EWR | $722M |
| Newark to Los Angeles | EWR-LAX | $682M |
| Singapore to Sydney | SIN-SYD | $650M |
| New York to Paris | JFK-CDG | $647M |
| Perth to Melbourne | PER-MEL | $642M |
As we can see, domestic flights comprised six of the 10 largest revenue-generating flights, with Sydney to Melbourne ranking first overall, at $1.21 billion.
In fact, this route is earning more than twice that of pre-pandemic levels, even as the number of passengers declined. The flight route is largely dominated by Qantas and Virgin Australia, with Qantas achieving record-breaking domestic earnings margins of 18% in the fiscal year ending in June 2023. Lower fuel costs and soaring ticket prices were key factors in driving revenues.
Furthermore, Qantas and Virgin Australia are major carriers for flights between Melbourne and Perth, another top-earning route.
New York to London, one of the busiest and most profitable routes globally, generated $1.15 billion in revenues, representing a 37% increase compared to the same period in 2019. Overall, the flight route had 3.88 million scheduled airline seats for the full year of 2023.
The highest revenue increase over this period was for flights from Dubai to Riyadh, with revenues surging 416% year-over-year. This two-hour flight, a highly lucrative route between major financial centers, is one of the busiest in the Middle East.

-

 United States5 days ago
Mapped: Countries Where Recreational Cannabis is Legal
-

 Technology2 weeks ago
Mapped: The Number of AI Startups By Country
-

 Healthcare2 weeks ago
Life Expectancy by Region (1950-2050F)
-

 Markets2 weeks ago
The Growth of a $1,000 Equity Investment, by Stock Market
-

 Markets2 weeks ago
Mapped: Europe’s GDP Per Capita, by Country
-

 Money1 week ago
Charted: What Frustrates Americans About the Tax System
-

 Technology1 week ago
Countries With the Highest Rates of Crypto Ownership
-

 Mining1 week ago
Where the World’s Aluminum is Smelted, by Country